Carbon Footprint in Custom Ceramic Tableware: The Complete Guide for B2B Buyers
Whether you are sourcing a signature dinnerware collection for a hotel group, a branded mug program for a restaurant chain, or a premium gifting range for a corporate client, sustainability is no longer a soft preference — it is a hard procurement criterion. At the centre of that conversation sits one number: carbon footprint.
This guide breaks down exactly how carbon footprint in custom ceramic tableware manufacturing is calculated, where the biggest emission hotspots are, what certified low-carbon production actually looks like, and — most importantly — how you can use this knowledge to make smarter, more defensible sourcing decisions.
What Is Carbon Footprint in Ceramic Tableware Manufacturing?
Carbon footprint is the total volume of greenhouse gas (GHG) emissions generated across all stages of a product’s life cycle, expressed in kilograms of CO₂ equivalent (kg CO₂e). For ceramic tableware, the standard reporting boundary is cradle-to-gate — from raw material extraction through to the moment the finished piece leaves the factory — as defined under ISO 14067:2018 and the GHG Protocol Product Standard.
It is important to distinguish carbon footprint from simple energy use. A factory running electric kilns on a coal-heavy grid can carry a higher carbon footprint than a gas-fired facility, because the carbon intensity of purchased electricity (Scope 2 emissions) must be factored in alongside direct combustion (Scope 1) and upstream supply chain emissions (Scope 3).
Why Custom Tableware Carries a Higher Carbon Burden Than Standard Production
Standard commodity tableware benefits from long, optimised production runs with near-full kiln utilisation. Custom ceramic tableware manufacturing introduces several carbon-amplifying variables:
- Multi-pass decoration firing — on-glaze decals, gold lustre, or overglaze enamel each require an additional firing cycle at 720–850 °C, adding 0.02–0.05 kg CO₂e per piece per pass.
- Short production runs — a kiln operating at 60% capacity consumes nearly the same base energy as one at 95% capacity. Per-piece carbon intensity rises sharply as batch size falls.
- Prototype iterations — rejected prototypes represent 100% carbon expenditure with zero saleable output, a hidden cost rarely disclosed by suppliers.
- Bespoke glaze profiles — specialty glazes often require extended peak-temperature soaks or non-standard firing curves, stretching cycle times and fuel consumption.
For a standard 26 cm dinner plate (fired weight ~260 g), the cradle-to-gate carbon footprint in a typical gas-fired facility ranges from 0.4 to 1.2 kg CO₂e per piece. Best-in-class European producers using electric kilns powered by renewable energy have achieved under 0.35 kg CO₂e per piece (CERAME-UNIE Environmental Report, 2023).
The Six Stages of Ceramic Production — And Their Carbon Emissions
Understanding where emissions occur is the first step toward evaluating your custom ceramic tableware manufacturer objectively.
Stage 1: Raw Material Extraction
The extraction and processing of primary ceramic raw materials — kaolin, feldspar, quartz, and ball clay — each carry an embedded carbon cost. Most of these materials have relatively low emission factors (0.015–0.048 kg CO₂e/kg). The exception is bone ash used in bone china bodies, which requires the calcination of animal bones at high temperatures and can reach 0.95–1.40 kg CO₂e/kg. This makes bone china bodies inherently higher-carbon than standard vitreous china or porcelain formulations — a point rarely discussed in marketing materials.
Transport distance is the other key variable at this stage. Sourcing raw materials from local quarries versus imported minerals can reduce Scope 3 upstream emissions by 10–30%.
Typical contribution to total carbon footprint: 5–8%
Stage 2: Body Preparation — Milling and Spray Drying
Once raw materials are blended, the slip (liquid ceramic mixture) is processed through high-energy ball mills and then spray-dried into flowable granules for pressing. Spray drying is the dominant energy consumer at this stage, typically using 0.8–1.5 MJ per kilogram of dried granulate depending on inlet moisture content.
Typical contribution to total carbon footprint: 8–12%
Key efficiency lever: reducing slip moisture content from 36% to 30% before spray drying can cut drying energy demand by approximately 15%, with a direct reduction in ceramic manufacturing carbon emissions at this stage.
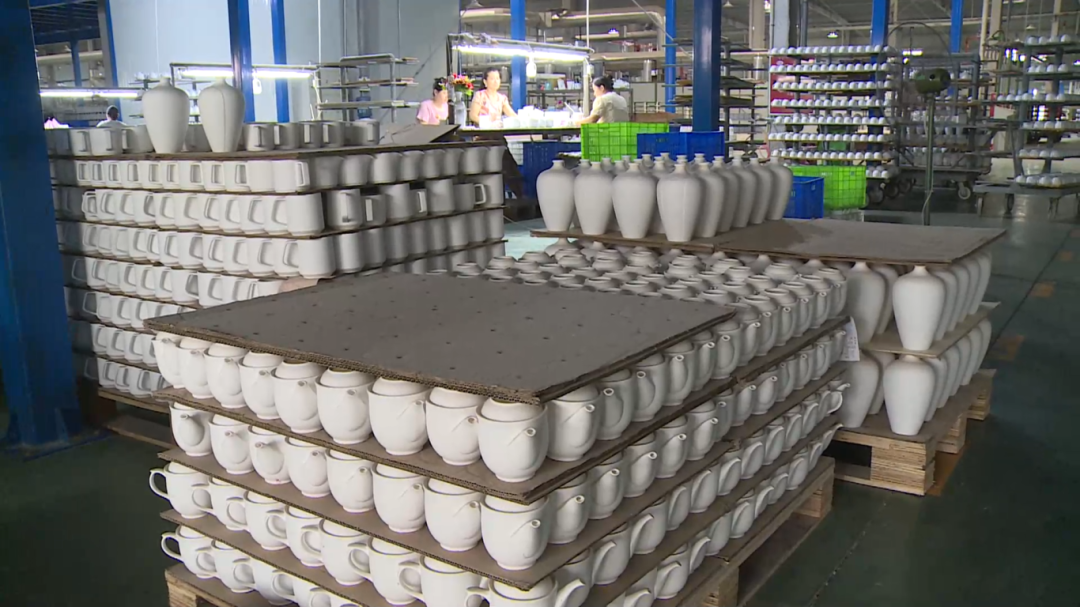
Stage 3: Forming and Drying
Shaping methods — ram pressing, roller forming (jiggering), or slip casting — consume relatively modest electricity (0.05–0.12 kWh per piece for mechanical pressing). Pre-firing drying at 80–120 °C removes residual moisture before the ware enters the kiln. This stage typically accounts for the smallest share of the total carbon footprint.
Typical contribution to total carbon footprint: 5–7%
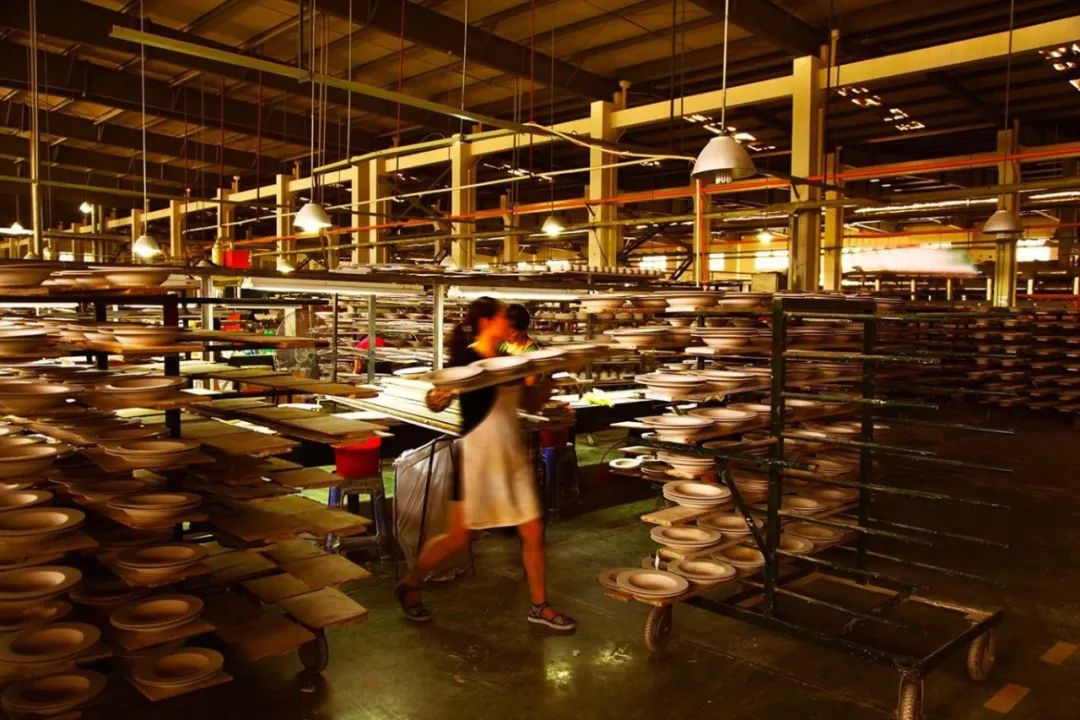
Stage 4: Bisque Firing — First Major Carbon Hotspot
Bisque firing (first kiln firing at 900–1050 °C) is where ceramic kiln energy consumption becomes the dominant cost driver. In this phase, several critical chemical transformations occur simultaneously:
- Kaolinite dehydroxylation at 500–600 °C releases water vapour and consumes significant fuel energy.
- Quartz inversion at exactly 573 °C involves a sudden crystal structure change (α→β silica) accompanied by a 0.82% volume expansion. Kilns must slow their heating rate to ≤ 80 °C per hour through this zone to prevent “dunting” cracks — extending firing time and fuel use.
- Organic burnout of residual carbon compounds between 400–700 °C requires adequate kiln ventilation and controlled heating rates; rushing this phase causes pinhole defects in the final glaze surface.
In a well-operated tunnel kiln, bisque firing consumes 2.5–4.5 MJ per kilogram of ware. Shuttle kilns — which many custom-order factories rely on for flexibility — typically consume 3.8–6.5 MJ/kg due to the need to heat and cool the entire kiln structure with each batch.
Typical contribution to total carbon footprint: 28–35%
Stage 5: Glazing and Glost Firing — The Single Largest Emitter
Glost firing at 1200–1400 °C (depending on body type) is the peak energy event in the entire production chain. At these temperatures, the ceramic body vitrifies and the glaze melts into a continuous glass layer — a process that demands 4–8 MJ per kilogram in conventional gas-fired kilns.
Bone china is fired at approximately 1220–1280 °C; hard-paste porcelain at 1280–1320 °C; stoneware at 1180–1250 °C; earthenware at 1050–1150 °C. Every 50 °C reduction in peak temperature corresponds to roughly an 8–12% reduction in fuel consumption, which is why earthenware products carry a structurally lower carbon footprint than porcelain — assuming equivalent kiln efficiency.
Typical contribution to total carbon footprint: 30–40%
Combined, bisque and glost firing account for 58–75% of total cradle-to-gate carbon emissions in ceramic tableware production. Kiln technology and fuel source are therefore the single most important variables in evaluating a supplier’s carbon performance.
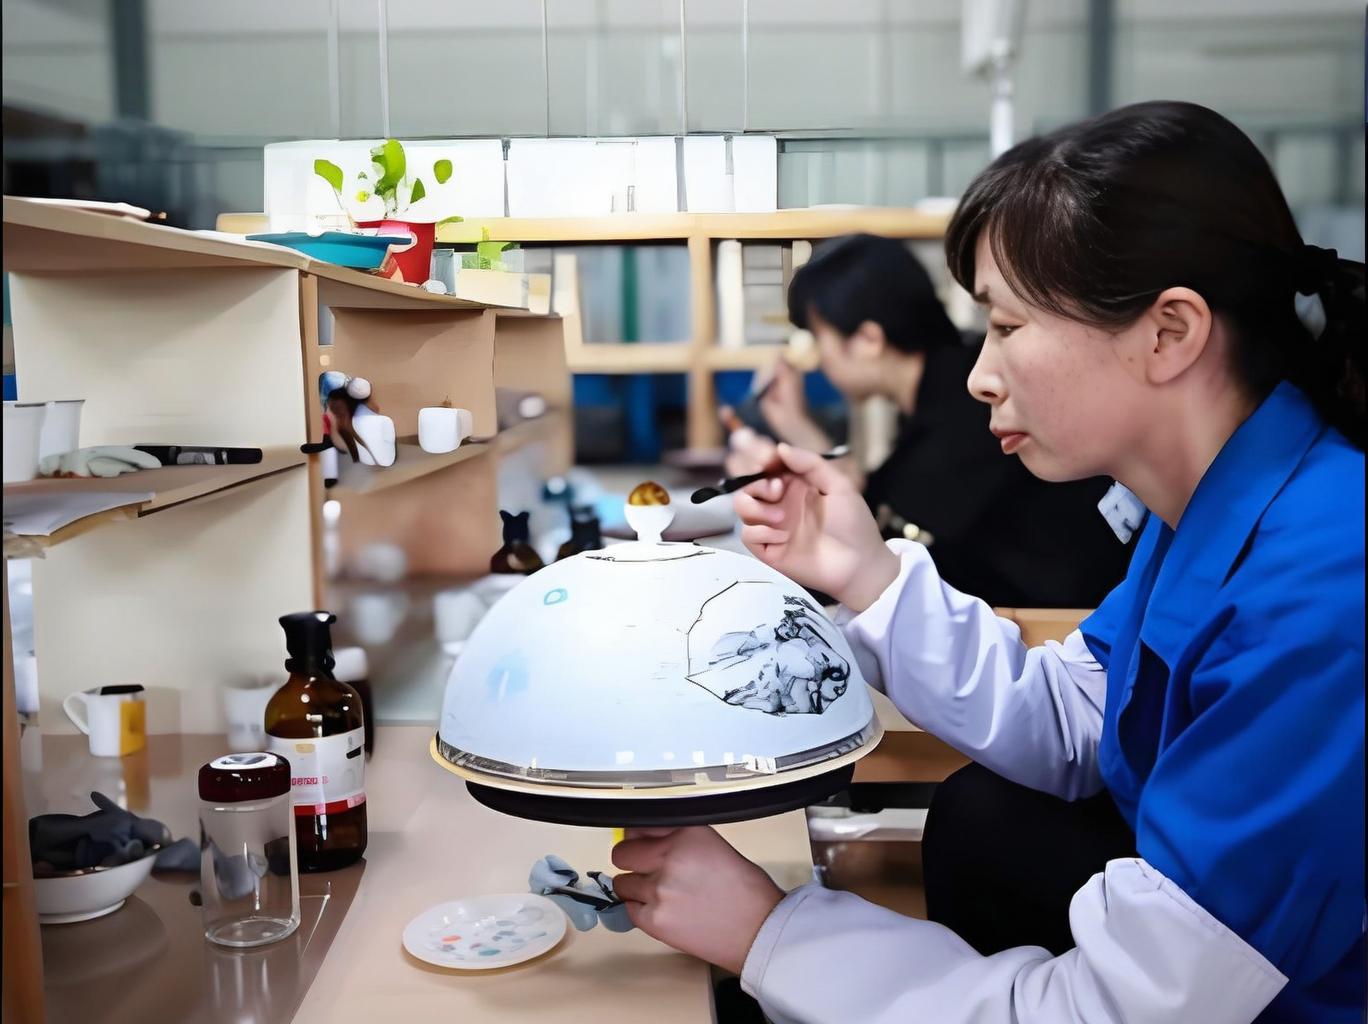
Stage 6: Decoration, Quality Control, and Packaging
On-glaze decoration requires additional low-temperature lehr firings (720–850 °C). Each pass adds approximately 0.3–0.8 MJ/kg and 0.02–0.05 kg CO₂e per piece. A fully custom piece with multi-colour overglaze decoration and a gold lustre border may require three to four additional firing passes after glost — accumulating a decoration-stage footprint that rivals some suppliers’ entire base manufacturing footprint.
Packaging materials (cardboard, foam inserts, pallets) add a further 3–8% depending on export packaging specification.
Typical contribution to total carbon footprint: 8–15%
Carbon Footprint Benchmarks by Product Type
Use these figures as reference points when evaluating supplier claims:
| Product | Typical CF (kg CO₂e/piece) | Best-in-Class CF |
|---|---|---|
| Dinner plate, 26 cm, vitreous china | 0.55 – 1.20 | ≤ 0.38 |
| Mug, 300 ml, stoneware | 0.28 – 0.65 | ≤ 0.20 |
| Cup & saucer set, bone china | 0.40 – 0.90 | ≤ 0.30 |
| Serving bowl, 25 cm, porcelain | 0.80 – 1.80 | ≤ 0.60 |
| Espresso cup, 90 ml | 0.12 – 0.30 | ≤ 0.09 |
Sources: Ecoinvent v3.9; Fraunhofer ISI Ceramics LCA Study (2021); CERAME-UNIE (2023)
International Standards Every Buyer Should Know
When a supplier makes a carbon or sustainability claim, these are the standards that give it legal and commercial credibility.
ISO 14067:2018 — The Product Carbon Footprint Standard
ISO 14067 ceramic certification is the primary international standard for quantifying and communicating the carbon footprint of a product. It defines the system boundary (cradle-to-gate vs. cradle-to-grave), the functional unit, and the calculation methodology. Any carbon footprint figure from a supplier should reference this standard — claims made without a named methodology should be treated with caution.
ISO 14025 — Environmental Product Declarations (EPDs)
A ceramic tableware EPD (Environmental Product Declaration) is a third-party verified document that communicates a product’s environmental impacts — including carbon footprint — across its life cycle. EPDs are produced in accordance with Product Category Rules (PCRs) and verified by independent programme operators such as Environdec or the International EPD System. An EPD is the gold standard of environmental transparency in B2B ceramic tableware sourcing.
EU BREF for Ceramics Manufacturing (2022)
The European Union’s Best Available Techniques Reference Document (BREF) for ceramics sets regulatory benchmarks for specific energy consumption. For table and ornamental ceramics in tunnel kiln production, the associated emission level is 2.5–5.0 GJ per tonne of ware. Suppliers operating within EU jurisdiction must comply; buyers sourcing from outside the EU can use these figures as a performance benchmark.
GHG Protocol Product Standard
The World Resources Institute (WRI) and WBCSD Product Life Cycle Accounting Standard is the de facto global framework for product-level GHG inventory. It defines Scope 1 (direct combustion), Scope 2 (purchased electricity), and Scope 3 (value chain) emissions — the three categories you should expect any credible low carbon ceramic supplier to report separately.
How to Evaluate Your Supplier’s Carbon Credentials
Tier 1 — Baseline Due Diligence
Every supplier you work with should be able to answer these questions:
- Do you track monthly energy consumption (gas, electricity) at the production unit level?
- What is your specific energy consumption (SEC) per kilogram of fired ware, by kiln type?
- Do you operate tunnel kilns or shuttle kilns for your main production volume?
A low carbon ceramic supplier operating tunnel kilns on natural gas should be reporting SEC figures of 3.0–5.0 MJ/kg for combined bisque and glost firing. Shuttle kiln operations above 6.5 MJ/kg with no efficiency roadmap are a structural carbon risk.
Tier 2 — Preferred Supplier Standards
For strategic sourcing relationships, seek suppliers who can demonstrate:
- A third-party verified ceramic tableware EPD or ISO 14064-1 organisational GHG inventory
- A documented carbon reduction roadmap with year-on-year SEC improvement targets
- Waste heat recovery systems on tunnel kilns (recuperative burners, preheated combustion air can reduce fuel use by 15–25%)
- Kiln loading optimisation protocols targeting ≥ 85% volumetric utilisation
Tier 3 — Leadership Benchmark
The highest-performing suppliers in sustainable tableware manufacturing are transitioning to:
- Electric kilns powered by renewable energy, reducing kiln-stage Scope 1 emissions toward zero
- Green hydrogen or biomethane as a drop-in replacement for natural gas in existing tunnel kilns
- Product-level EPD reporting covering each SKU in the custom tableware range, not just a factory average
Red Flags to Watch For
- “Eco-friendly production” marketing claims with no specific SEC or CO₂ data attached
- Self-declared EPDs without a named third-party verification body
- SEC figures below 2.0 MJ/kg claimed for shuttle-kiln operations (physically implausible — shuttle kilns must heat and cool their full refractory mass every cycle)
- No distinction between Scope 1 and Scope 2 emissions in reported figures
The Business Case: Why Carbon Data Protects Your Supply Chain
Regulatory Compliance Risk
The EU Corporate Sustainability Reporting Directive (CSRD), effective 2024, requires companies with over 250 employees or €40 million in turnover to report Scope 3 (supply chain) emissions. If you cannot obtain verified carbon data from your ceramic tableware supplier, those emissions appear in your sustainability report as an unquantified liability — a growing problem for listed companies and those selling into European markets.
Brand Reputation and ESG Commitments
Hospitality groups, retail chains, and corporate clients are increasingly setting public Science Based Targets (SBTi commitments). Sourcing from a supplier who cannot provide credible carbon footprint ceramic tableware data undermines those commitments and creates reputational exposure.
Future-Proofing Against Carbon Pricing
While ceramics are not yet within the first tranche of the EU Carbon Border Adjustment Mechanism (CBAM, fully operational from 2026), the regulatory trajectory is clear. Buyers who build verified low-carbon supplier relationships now are insulated against future import cost adjustments.
Conclusion
Carbon footprint in custom ceramic tableware manufacturing is no longer a niche environmental metric — it is a quantifiable measure of operational efficiency, regulatory readiness, and long-term supply chain resilience.
The most carbon-intensive operations in any ceramic factory are the kilns. Buyers who understand this can ask the right questions: What is your SEC per kilogram of fired ware? Do you operate tunnel or shuttle kilns? Is your electricity sourced from renewables? Do you hold a third-party verified EPD?
Suppliers who can answer these questions with data — not marketing language — are the partners best positioned to help you meet your own sustainability commitments while delivering the quality and consistency that eco-friendly ceramic dinnerware requires at scale.
References
- ISO 14067:2018 — Carbon footprint of products — https://www.iso.org/standard/71206.html
- EU BREF Ceramics Manufacturing Industry (2022) — https://eippcb.jrc.ec.europa.eu/reference/ceramic-manufacturing-industry
- GHG Protocol Product Standard (WRI/WBCSD) — https://ghgprotocol.org/product-standard
- CERAME-UNIE Environmental Report 2023 — https://www.cerame-unie.eu/sustainability/
- IEA World Energy Outlook 2023 — https://www.iea.org/reports/world-energy-outlook-2023
- Ecoinvent v3.9 Life Cycle Inventory Database — https://ecoinvent.org/
- Science Based Targets initiative (SBTi) — https://sciencebasedtargets.org/
- EU Carbon Border Adjustment Mechanism (CBAM) — https://taxation-customs.ec.europa.eu/carbon-border-adjustment-mechanism_en
Custom Solutions Available
Our technical experts are always ready to assist you in finding the perfect customized solution for your dinnerware needs.